PRODUCT

Market Intelligence GraphProvider Intelligence, Rate Scores, and Benchmarks

Who providers are, where they stand in their market, and what they negotiate. All in one place.
Request a Demo
Gigasheet Provider Rate Score gauge showing a provider's market position as Below Market versus the New York market, with the five-band legend from Bottom of Market to Top of Market

Provider Intelligence

Know the landscape before you contract, steer, or sell.

Identity and Practice

Specialty, board certifications, locations, contact details, education, affiliations, languages, telehealth, and new-patient status where available.

Online Reputation

Patient ratings and digital presence to gauge provider visibility and reputation.

Regulatory Standing

License status, board and disciplinary actions, and Medicaid exclusions, summarized with the underlying records preserved.

Medicare and Industry Ties

Medicare enrollment and opt-out status, plus manufacturer payments reported through Open Payments.

Network Intelligence

Published payer and plan associations for network research and directory validation.

Commercial Pricing

Negotiated rates, Medicare benchmarks, and local market comparisons for every provider.

Every record carries its public source and reporting date. Built for care navigation and steering, network adequacy and directory accuracy, network development, and provider targeting.

Provider Rate Scores

Above Market VS LA MARKET
Market position
Rate Score

Every published rate scored against the market it competes in.

Bottom of Market
Below Market
At Market
Above Market
Top of Market
Rate Score evidence
Below market
At market
Above market

Spot High- and Low-Cost Providers Fast

See immediately whether a provider's negotiated rates tend to run below, near, or above comparable providers in the local market. Quickly identify where pricing stands out without analyzing thousands of individual rates.

Understand What's Driving the Difference

Go beyond the headline score to see where a provider is more or less competitive by payer, procedure, specialty, and care setting. Find the specific relationships driving market position.

Turn Pricing Data Into Action

Use rate position to prioritize contracting opportunities, strengthen network strategy, guide provider selection, or identify where deeper analysis is warranted.

Preview Any Provider

Enter any NPI to see a live Rate Score: specialty, location, market band, and a plain-language interpretation. The payer, procedure, and care-setting detail behind the score comes with licensed benchmarks.

Try it live
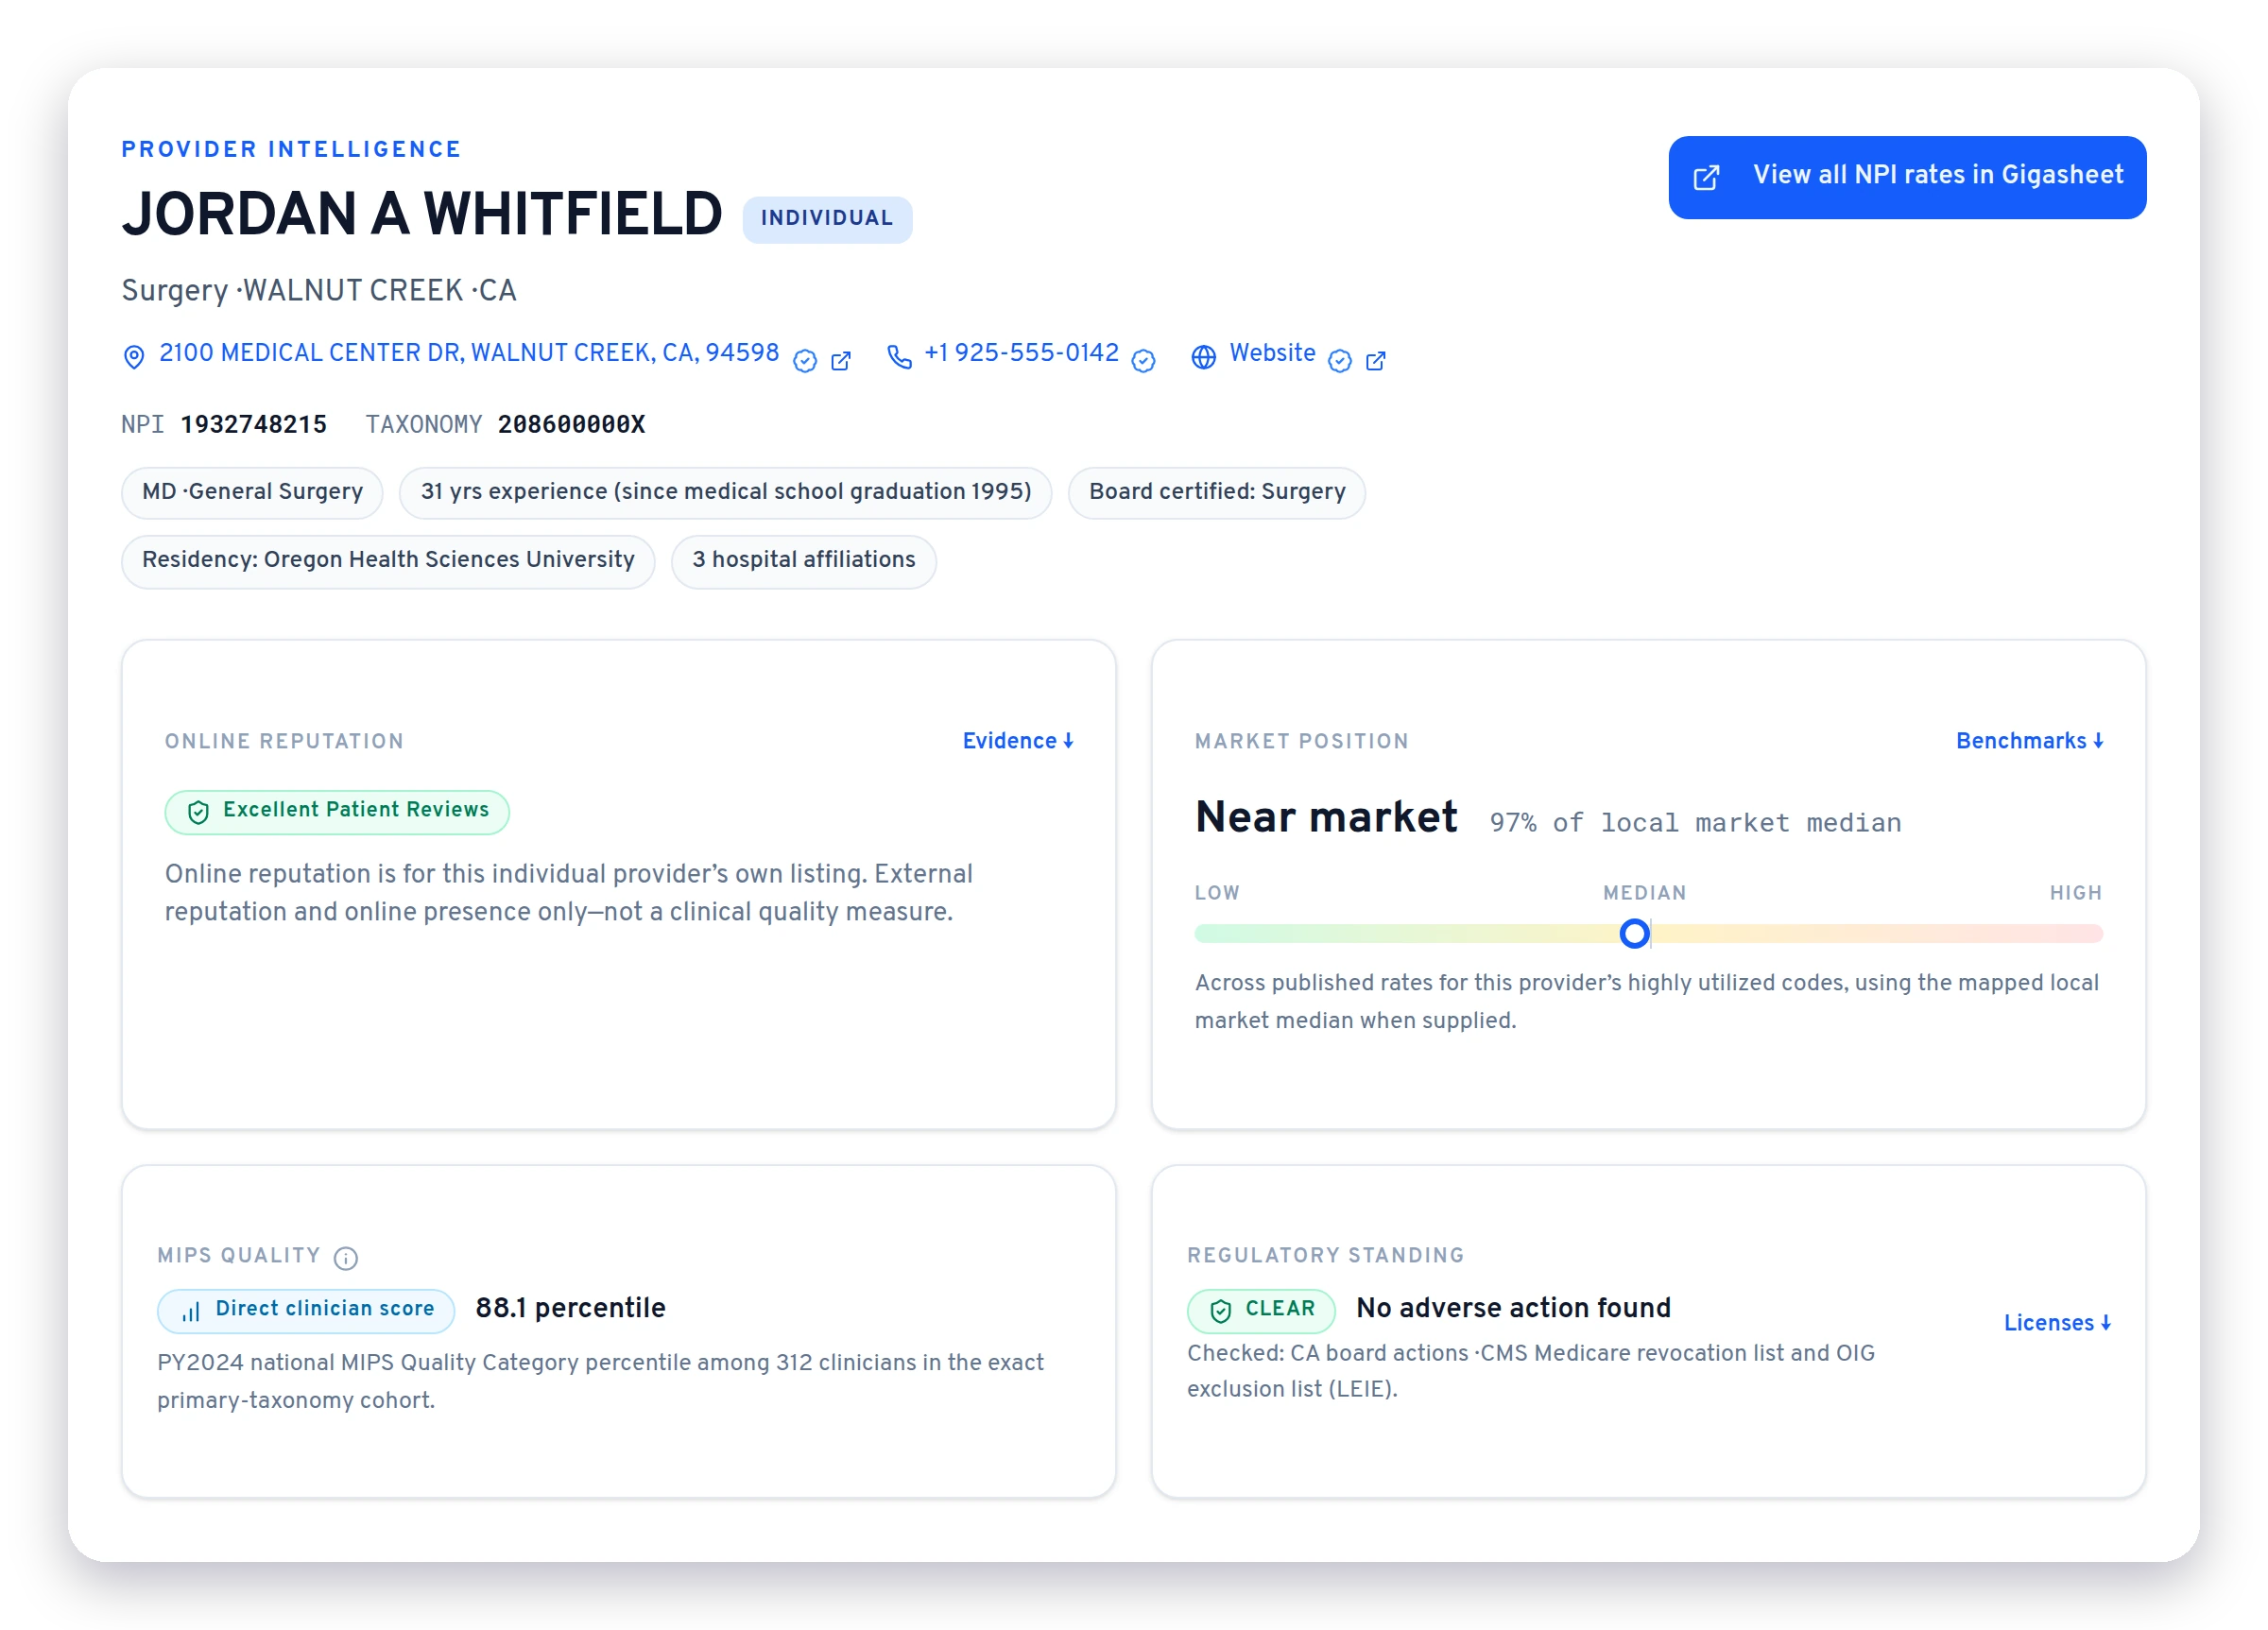
Gigasheet provider intelligence

Market Benchmarks

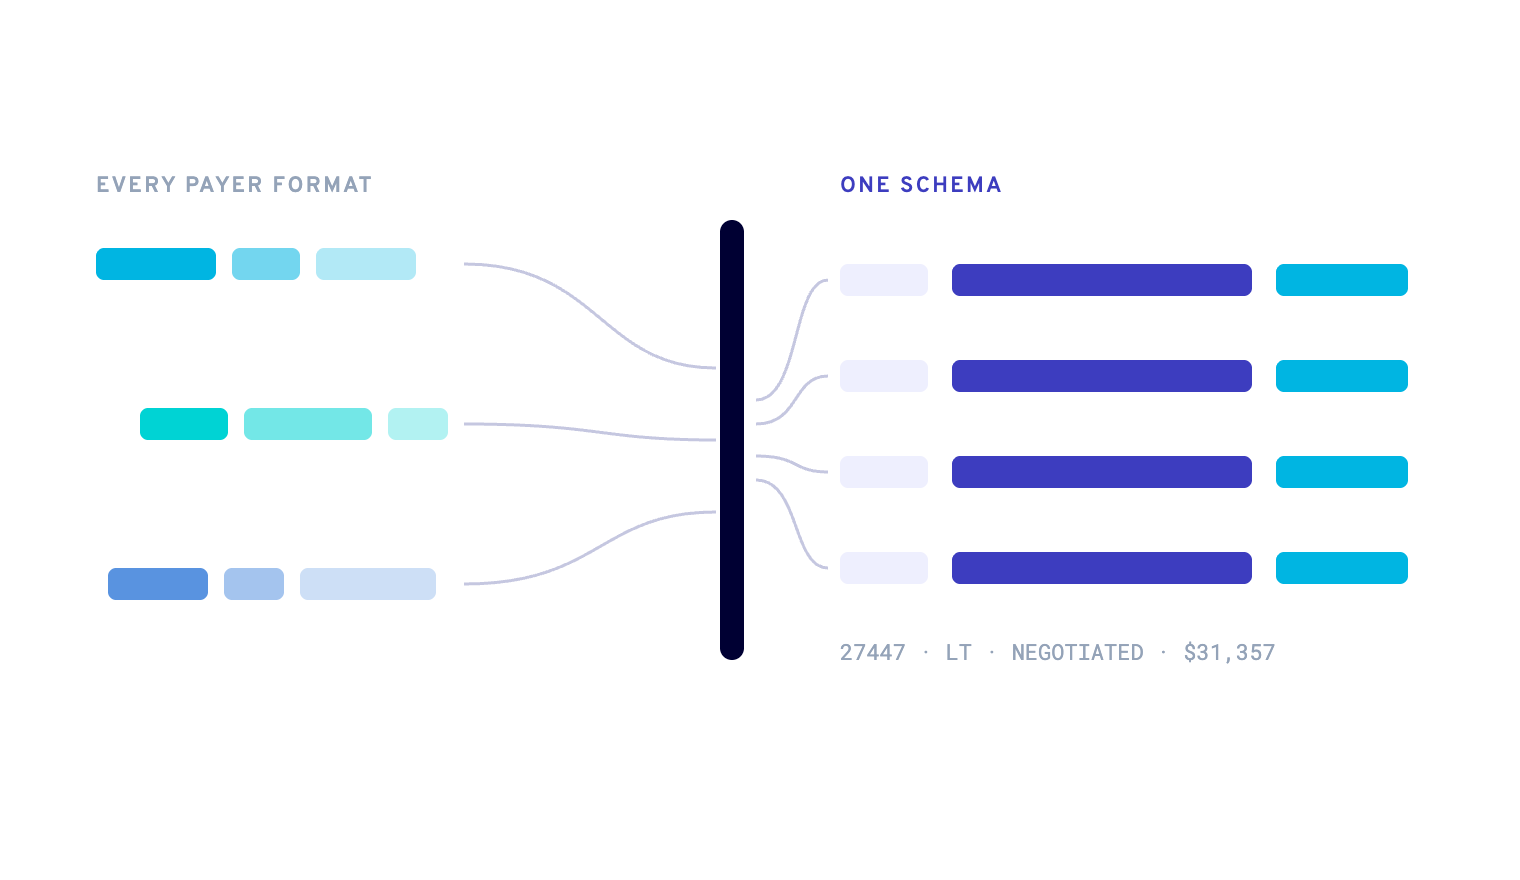
Diagram showing rate records in every payer's own format normalized into one consistent schema

Peer and Payer Medians by Market

Median negotiated rates across comparable providers and payers for each specialty, procedure, and local market. Grounded in published rates, not sampled contracts.
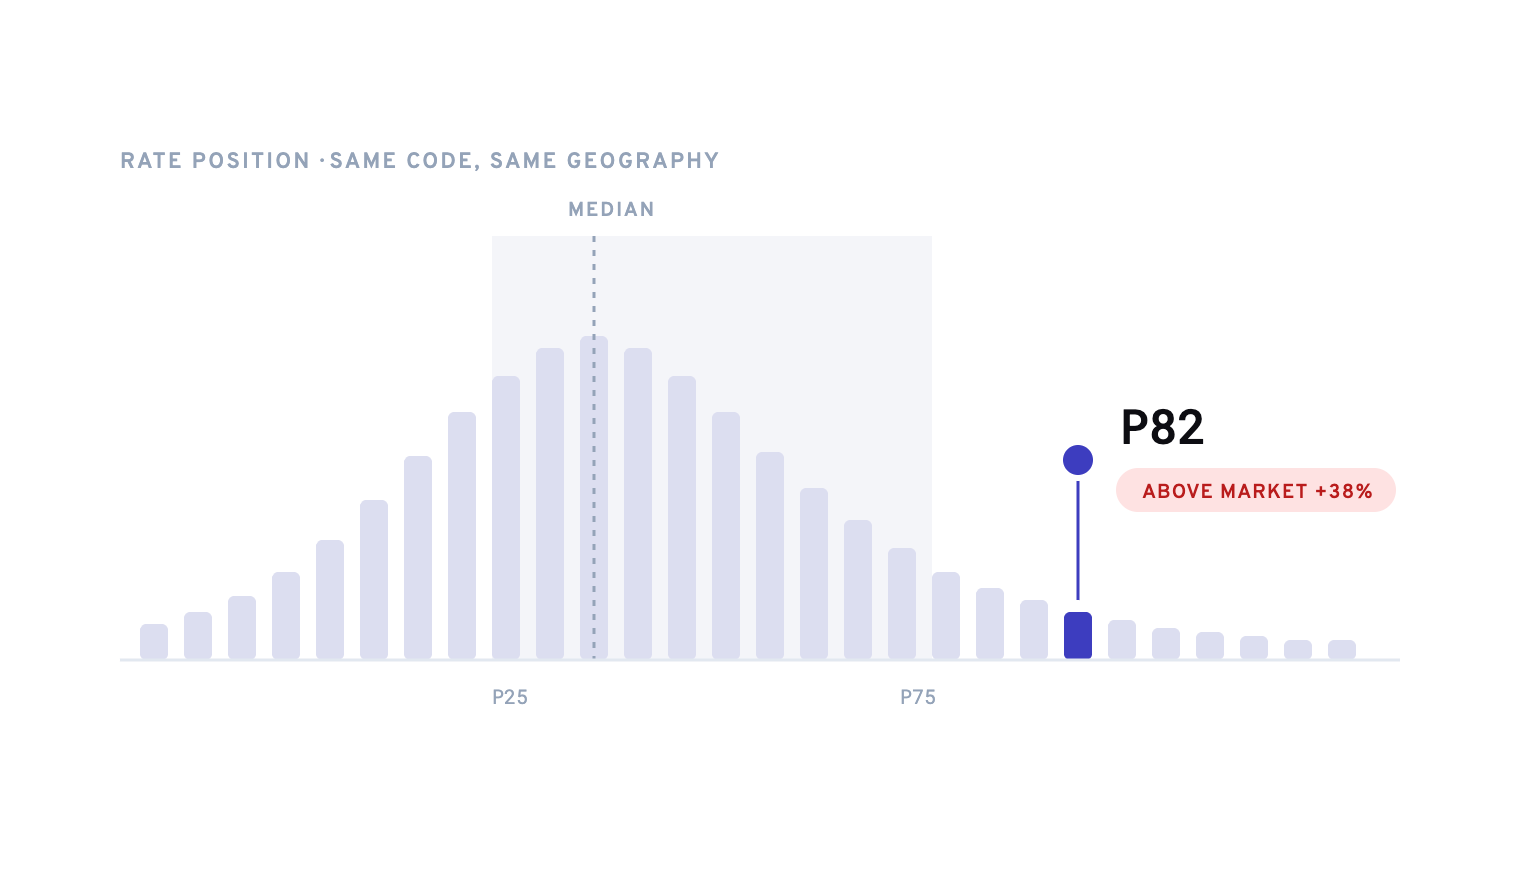
Distribution chart showing a negotiated rate's position at the 82nd percentile against the market for the same billing code and geography

Medicare Reference Rates Included

Reference-based pricing starts with Medicare. Every benchmark ships alongside geographically adjusted Medicare rates for professional services, hospital outpatient, and ambulatory surgery centers, so you can express any negotiated rate as a percent of Medicare in the same view.
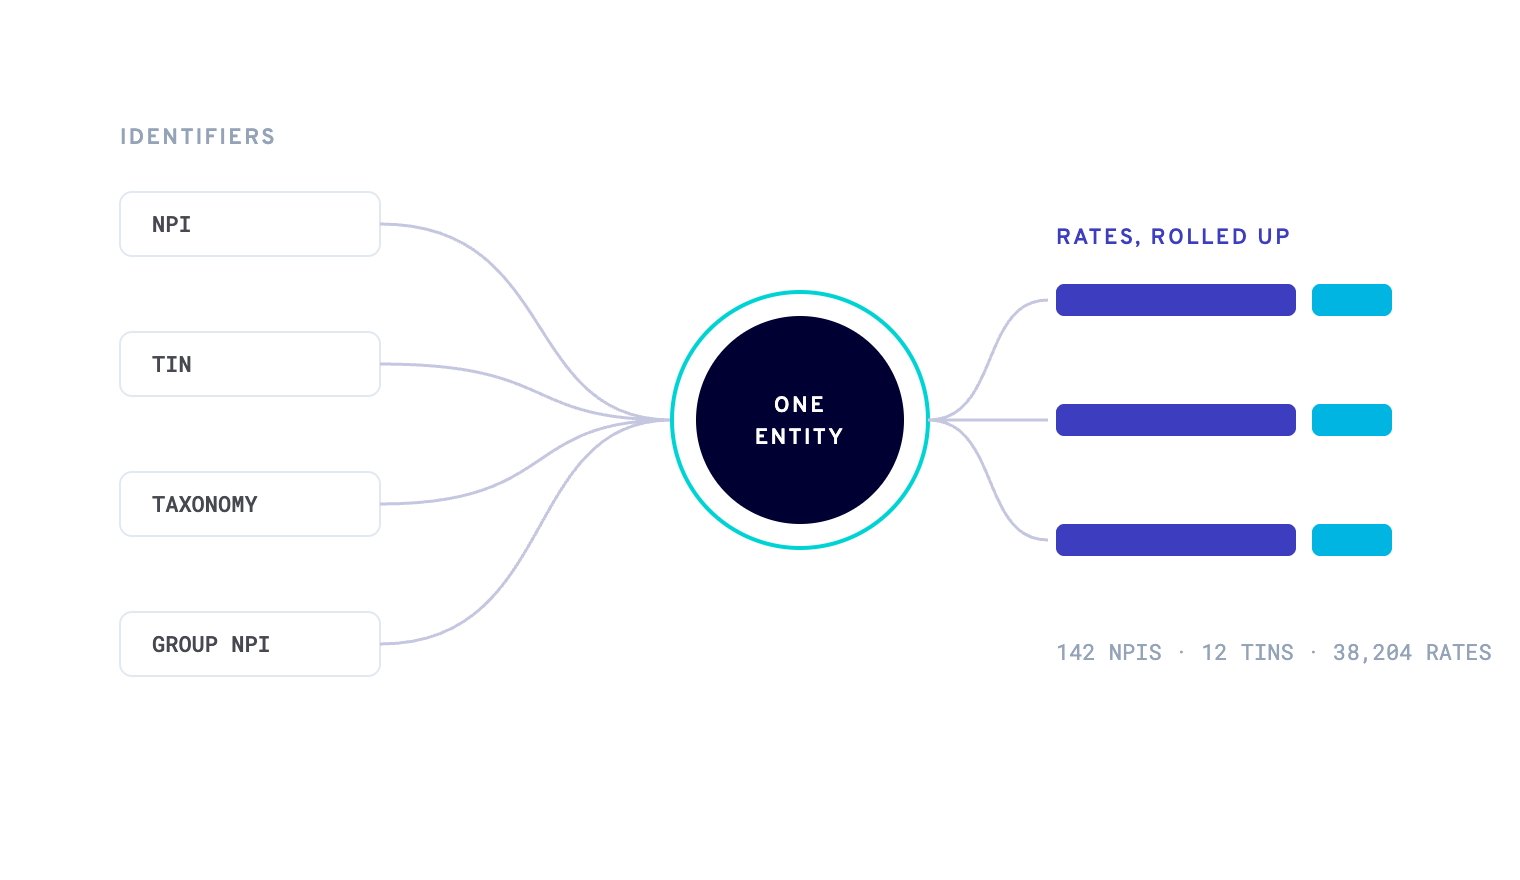
Diagram showing NPI, TIN, taxonomy, and group NPI resolved into one provider entity with rates rolled up

Any Cut You Need

Benchmark by provider, payer, network, procedure, specialty, geography, or care setting. Compare a surgeon against peers for one procedure under one plan, or roll up an entire market by specialty.

How the Graph Is Built

Entity Resolution

Providers, groups, and facilities matched across sources into a single record.

Comparable Peers

Providers are measured against their own specialty in their own local market, never a national average.

Quality Controls

Anomalous and non-comparable rates are excluded, and scores are issued only where the evidence supports them.

Put the Graph to Work

Price Transparency Explorer

Research any provider, market, or payer.
Learn more

Analytics API

Build the graph into your product.
Learn more

AI Agent

Ask in plain language, get a report with the backing data.
Learn more

Bulk Data

License the datasets for your own environment.
Learn more

Frequently Asked Questions

What is the Market Intelligence Graph?

The Market Intelligence Graph is Gigasheet's intelligence layer on top of national price transparency data. It brings Provider Intelligence, Provider Rate Scores, and market benchmarks together in one place.

What is Provider Intelligence?

Provider Intelligence combines clinician identity and practice information, online reputation, regulatory standing, Medicare and industry relationships, published network associations, and commercial negotiated rates in a single provider profile. It covers more than 2.3 million clinicians, with licensing and regulatory information across more than 40 jurisdictions.

What is a Provider Rate Score?

A Provider Rate Score is Gigasheet's proprietary benchmark for how a provider's negotiated rates compare to market, adjusted for specialty-specific billing patterns. It places a provider in one of five bands, from Bottom of Market to Top of Market, relative to comparable providers in the same local market.

Who is the Market Intelligence Graph for?

Payers and network teams, health systems and provider groups, care navigation and digital health companies, self-funded employers and benefits consultants, cost containment organizations, and life sciences and medtech teams. Each uses the graph to evaluate providers, research networks, and compare costs.

Does Provider Intelligence verify current network participation?

No. Published network associations reflect what payers and other sources disclose. They are useful for research and for spotting potential directory discrepancies, but current participation should be confirmed directly with the health plan.

Is Provider Intelligence a substitute for credentialing?

No. Regulatory indicators summarize available public records and preserve access to the underlying details. They are not a substitute for formal provider credentialing or primary-source verification.

Do benchmarks include Medicare rates?

Yes. Geographically adjusted Medicare rates for professional, hospital outpatient, and ambulatory surgery center settings are included, so any negotiated rate can be expressed as a percent of Medicare for reference-based pricing analysis.

Does a Rate Score measure quality or predict a patient's bill?

No. A Rate Score measures negotiated-rate position only. It is not a measure of clinical quality, a patient cost estimate, or a recommendation of a particular provider. A patient's actual cost depends on the plan, benefits, site of service, and services billed. Licensed data provides payer, plan, provider, and procedure-level rates for deeper cost analysis.

Healthcare price intelligence

National Coverage
Scored & Benchmarked Rates
Expert Support
Request a Demo
LOW $1,804
MEDIAN $6,537
HIGH $21,743

By using this website, you agree to the storing of cookies on your device to enhance site navigation, analyze site usage, and assist in our marketing efforts. View our Privacy Policy for more information.