Healthcare organizations leave millions on the table each year because they lack systematic visibility into payer performance patterns and competitive rate positioning. Most finance teams rely on periodic audits and anecdotal observations from billing staff rather than comprehensive analytics that reveal underpayments as they happen.
This guide walks through the data sources, metrics, and analytical frameworks that transform reimbursement from reactive problem-solving into proactive optimization. You'll learn how to detect payment anomalies, benchmark against market rates, and build negotiation strategies backed by concrete evidence rather than assumptions.
What Is Data-Driven Reimbursement Optimization
Data-driven reimbursement optimization means using analytics to spot underpayments, track how each payer performs, and build stronger negotiating positions through concrete numbers. Instead of relying on gut feelings or periodic audits, organizations analyze denial patterns, clean claims ratios, and profitability margins across every payer contract. The approach catches payment anomalies in real time rather than months later when the revenue is already lost.
Traditional methods depend on manual spot checks and anecdotal observations from billing staff. With data-driven strategies, you see exactly which payers consistently underpay specific service lines, which contracts drain profitability, and where your rates fall compared to market standards turning raw payment information into decisions that directly affect your margins.
Why Payer Performance Metrics Matter for Margin Growth
Without systematic tracking, healthcare organizations miss underpayments and accept suboptimal contract terms simply because they lack visibility into payer behavior patterns. When you quantify how each payer performs against contracted rates and regional benchmarks, you gain concrete evidence to challenge discrepancies and renegotiate unfavorable agreements.
Organizations with robust payer analytics make smarter decisions about network participation and service line investment because they understand the true profitability behind each relationship. The difference between hoping payers reimburse correctly and knowing they do creates competitive separation in tight margin environments.
Core Data Sources for Revenue Cycle Analytics
Effective optimization pulls together multiple data types to create a complete picture of payment patterns and competitive positioning. Each source reveals different aspects of revenue cycle performance, and connecting them systematically is where the real insights emerge.
Price Transparency Machine Readable Files
Machine readable files from the Transparency in Coverage rule contain negotiated rates that payers have agreed to pay providers for specific services. These files expose actual contracted rates across thousands of healthcare organizations, creating visibility into competitive positioning that didn't exist before. You can now see exactly where your negotiated rates fall compared to regional peers for the same procedures.
Historical Claims and Denials Data
Your internal claims database shows payer-specific payment behaviors, denial patterns, and processing timelines that indicate systematic issues. Tracking which payers consistently deny certain procedure codes or delay payment beyond contracted terms helps prioritize where to focus improvement efforts. This historical record also establishes baseline performance that measures whether optimization initiatives actually work.
Contract Terms and Fee Schedules
Turning contract language and fee schedules into queryable data enables systematic analysis of payment terms that typically sit in static PDF files. When contract terms become searchable information, you quickly identify outlier rates, unfavorable clauses, and renegotiation opportunities across your entire payer portfolio. This shift from unstructured documents to structured data makes contract management scalable beyond a handful of major payers.
External Market Intelligence Benchmarks
Third-party market data validates whether your internal performance assumptions align with broader industry trends. External benchmarks help distinguish between organization-specific issues and market-wide challenges, informing more realistic targets. These comparisons also strengthen negotiation positions by providing objective evidence of rate disparities that payers can't easily dismiss.
Key Metrics to Track Across Claims and Contracts
Five core metrics provide the foundation for optimization, each revealing different dimensions of financial performance. Tracking these consistently across all payers exposes patterns that drive strategic decisions.
1. Denial Rate
Denial rate measures the percentage of submitted claims that payers reject, directly impacting cash flow since each denial requires staff time to research and resubmit. Calculate this by dividing total denied claims by total claims submitted, then break it down by payer, service line, and denial reason to find root causes. High-performing organizations typically achieve denial rates below 5% through proactive claim scrubbing before submission.
2. Clean Claims Ratio
Clean claims get processed and paid without requiring additional information, corrections, or appeals. A higher ratio translates to faster payment cycles and lower administrative overhead since your staff spends less time on rework. Organizations achieving ratios above 95% typically employ automated validation that catches errors before claims leave the building.
3. Average Reimbursement per Case Mix Adjusted DRG
This metric reveals true payer performance by accounting for patient complexity variations that affect resource consumption. Without case mix adjustment, comparing reimbursement across different patient populations produces misleading conclusions about payer generosity. Benchmark your adjusted rates against regional averages to identify which payers consistently reimburse below market for comparable patient acuity.
4. Days in Accounts Receivable
Days in accounts receivable measures how long it takes to collect payment after services are rendered. Calculate this by dividing outstanding receivables by average daily charges. Every day of delay represents capital tied up in uncollected revenue, directly affecting working capital and cash flow predictability.
5. Payer Specific Profitability Margin
Calculate margin by subtracting direct and indirect costs from payer reimbursement rates, revealing which contracts actually contribute to financial sustainability. This metric guides decisions about contract renewal priorities and network participation—some high-volume payers may operate at negative margins when you account for true costs. Organizations often discover that 20% of payer contracts generate 80% of margin, fundamentally reshaping negotiation strategies.
Detecting Underpayments and Outlier Rates With AI
Artificial intelligence scales payment accuracy auditing from sample-based reviews to comprehensive analysis of every claim. Machine learning algorithms identify patterns across millions of transactions that human reviewers would never catch, such as specific procedure combinations that consistently pay below contracted rates. This transforms retrospective auditing into real-time monitoring that catches errors before they accumulate.
AI detection capabilities work through several mechanisms:
- Pattern recognition: Spots when specific payers systematically underpay certain service lines or provider types
- Anomaly detection: Flags unusual payment variations that deviate from established baselines and contracted terms
- Automated auditing: Reviews 100% of claims rather than statistical samples
The most sophisticated systems learn from historical data to predict which claims face high denial risk before submission, enabling proactive intervention rather than reactive appeals.
Five Step Framework to Improve Negotiations and Reimbursement
A systematic approach ensures comprehensive coverage while maintaining focus on high-impact opportunities. Following these sequential steps builds the analytical foundation for successful contract negotiations.
Step 1 Gather and Normalize Multisource Data
Start by extracting data from your claims management system, contract repositories, and external price transparency sources. Each system uses different formats and coding standards, so normalization requires mapping various procedure code systems like CPT, HCPCS, and DRG while standardizing provider identifiers. This foundational work determines the accuracy of all downstream analysis.
Step 2 Benchmark Against Market and Peer Rates
Compare your negotiated rates against market data from price transparency files to identify where you fall significantly above or below regional averages. Focus benchmarking on high-volume procedures and strategic service line priorities rather than attempting comprehensive analysis across all services. Geographic market dynamics matter—rates that seem competitive in rural markets may be substantially below urban standards.
Step 3 Prioritize High Impact Service Lines
Analyze which service lines represent the largest revenue opportunities based on volume, current margin, and potential rate improvement identified through benchmarking. A service line generating $10 million annually with rates 15% below market represents a $1.5 million opportunity. Prioritization also considers strategic factors like competitive differentiation and growth plans beyond pure financial calculations.
Step 4 Model Negotiation Scenarios and Financial Uplift
Build financial models that project annual revenue impact from various rate increase scenarios, accounting for potential volume shifts if payers resist certain terms. Scenario modeling helps you understand acceptable negotiation ranges and minimum viable outcomes before entering discussions. This preparation prevents reactive decision-making when payers present counteroffers during actual negotiations.
Step 5 Monitor Post Contract Performance
After contract implementation, track whether actual payments match newly negotiated terms through automated variance analysis. Payers sometimes continue paying old rates due to system update delays or operational errors, and catching these discrepancies quickly ensures you realize the full value of negotiation efforts. Ongoing monitoring also builds the performance history for the next negotiation cycle.
Implementation Best Practices for Analytics Adoption
Technology capabilities matter less than organizational adoption when implementing reimbursement analytics programs. The most sophisticated platform delivers no value if your teams don't trust the data or integrate insights into daily workflows.
Data Governance and SOC 2 Compliance
Establish clear policies defining who can access different data types, how long data is retained, and what security controls protect sensitive payment information. Healthcare reimbursement data often contains protected health information requiring HIPAA compliance alongside financial data security standards. SOC 2 Type II certification provides independent validation that your analytics platform maintains appropriate security controls.
Role Based Dashboards for Finance and Contracting Teams
Design different views for executives who want high-level trends versus operational staff who require claim-level detail to investigate specific payment issues. CFOs want to see overall payer performance and contract portfolio health, while revenue cycle managers drill down to identify root causes of denial spikes. This role-based approach prevents information overload while ensuring each team member sees relevant metrics.
Automated Alerts for Outlier Rates
Configure threshold-based notifications that proactively alert relevant team members when payment patterns deviate from expected ranges or contracted terms. For example, if a major payer's denial rate suddenly increases by 20%, immediate notification enables rapid investigation before the issue compounds. Effective alerting balances sensitivity to catch meaningful changes against specificity to avoid alert fatigue.
Change Management and Training
Address the natural resistance that emerges when introducing data-driven approaches to teams accustomed to relationship-based payer management. Training emphasizes how analytics augment rather than replace human judgment, providing evidence to support negotiations rather than dictating decisions. Success measurement includes both technical metrics like system adoption rates and outcome metrics like improved contract terms.
Calculating ROI and Building a Continuous Improvement Loop
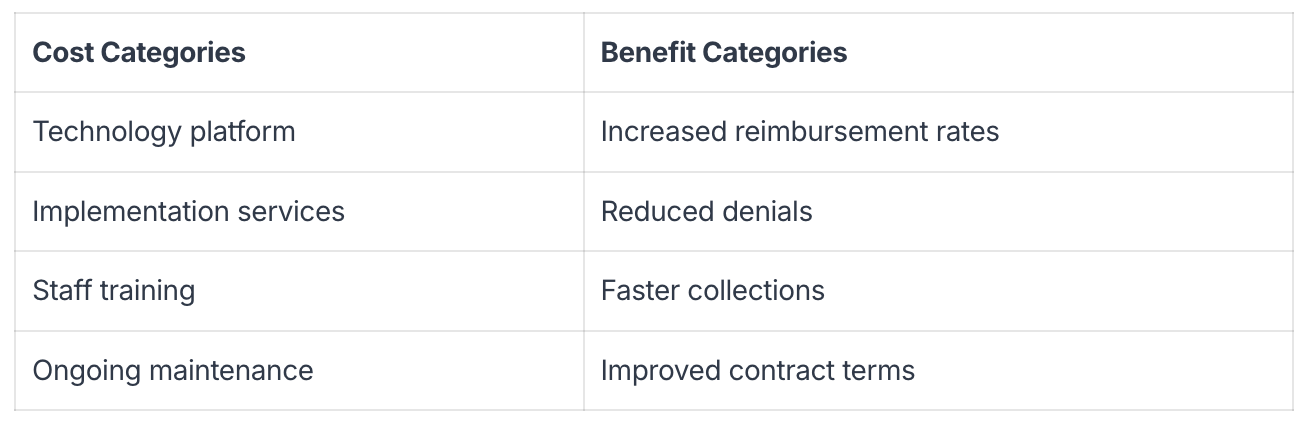
Measuring return on investment for reimbursement analytics programs requires tracking both hard savings from increased payments and soft benefits like reduced administrative time. Most organizations see payback periods of 6-12 months when they systematically pursue identified underpayments and use market intelligence in contract negotiations.
Continuous improvement means regularly reviewing which data sources provide the most actionable insights and refining analytical approaches based on what drives actual results. Organizations that treat analytics as an ongoing program rather than a one-time project compound benefits over time.
Emerging Trends Shaping Future Reimbursement Models
The healthcare payment landscape continues evolving rapidly, with new models and technologies reshaping how organizations approach reimbursement optimization. Staying ahead of these trends positions your organization for sustainable competitive advantage.
Predictive Pricing Powered by Generative AI
Generative AI models trained on historical negotiation outcomes can now forecast likely payer responses to specific rate increase requests. These systems analyze patterns across thousands of contract negotiations to identify which arguments and data points most effectively drive favorable outcomes. The technology moves beyond descriptive analytics that explain what happened toward prescriptive recommendations about what actions to take.
Shift to Value Based Care and Quality Tied Incentives
As payers increasingly tie reimbursement to quality metrics and outcome measures rather than pure volume, organizations integrate clinical data with payment data to understand how quality scores affect total reimbursement. This transition requires connecting clinical performance to financial results across different contracts. Organizations that excel treat quality improvement as a revenue optimization strategy.
Employer Led Reference Based Pricing
Large employers increasingly contract directly with providers using reference-based pricing models that pay fixed percentages above Medicare rates rather than negotiated fee schedules. This trend disrupts traditional payer relationships and requires providers to understand their cost structures relative to Medicare benchmarks. Organizations unprepared for reference-based pricing may find themselves accepting unfavorable terms or losing access to large patient populations.
Real Time Eligibility and Price Estimates at Point of Care
Patients increasingly expect upfront price transparency, and systems that provide real-time cost estimates at scheduling or registration improve collection rates and patient satisfaction. These capabilities require integrating eligibility verification, benefit details, and contracted rates into patient-facing systems. Organizations that deliver accurate price estimates build trust and reduce surprise billing complaints.
Unlock Reliable Insights With Gigasheet
Healthcare organizations face a persistent challenge: price transparency data lives in massive machine-readable files containing billions of rates, but traditional analytics tools struggle to process datasets at this scale. Gigasheet solves this by combining a familiar spreadsheet interface with enterprise-grade data processing that handles the largest healthcare pricing datasets without requiring data warehouses or complex infrastructure.
The platform's AI-powered analytics automatically surface pricing anomalies and competitive opportunities across thousands of payer contracts, eliminating the manual analysis that typically consumes weeks of analyst time. Every insight traces back to its source data, so you can verify exactly which contract term or rate table produced each finding—building the confidence to challenge payer underpayments and negotiate from positions of strength.
The spreadsheet-like interface means your existing finance and contracting teams can start analyzing complex pricing data immediately without specialized training, while SOC 2 Type II compliance ensures your sensitive payment data remains secure. Book a demo to see how Gigasheet transforms healthcare price transparency data into actionable reimbursement strategies.
FAQs About Data Driven Reimbursement Optimization
How can small hospitals start reimbursement analytics without a data warehouse?
Cloud-based analytics platforms eliminate the need for expensive data warehouse infrastructure by processing data directly from your existing systems. These solutions integrate with standard claims management and EHR systems through secure APIs, providing immediate insights without requiring IT teams to build custom data pipelines. The key is choosing platforms designed specifically for healthcare data that understand industry-standard formats and coding systems.
What security standards should a healthcare reimbursement analytics platform meet?
Healthcare analytics platforms handling payment data require SOC 2 Type II compliance at minimum, which validates that appropriate security controls are in place and independently audited. HIPAA compliance becomes necessary if your analysis includes any protected health information beyond de-identified payment amounts. Look for platforms that maintain healthcare-specific security certifications and conduct regular penetration testing to identify vulnerabilities.
How do organizations merge machine readable pricing files with internal claims data?
Modern analytics platforms automate the integration process through intelligent data mapping that matches procedure codes, provider identifiers, and service descriptions across different data sources. The process involves standardizing various coding systems like CPT, HCPCS, and DRG while normalizing provider names and identifiers to create unified datasets. Organizations that previously spent weeks manually reconciling these data sources now complete integration in hours using purpose-built healthcare analytics tools.
The intelligence layer for price transparency.

Similar posts